Functions & Graphs
In this article we first give a practical definition of a function and then demonstrate the graphs of functions in the Cartesian coordinate system and the polar coordinate system.
A function from a set A to a set B is simply a rule which assigns to each element in the set A a unique element in the set B. The set A is called the domain of the function and the set B is called the range of the function.
When talking about a real valued function of real numbers (that is, when both the domain A and the range B of the function are the set of real numbers), the rule of assignment is usually expressed as a formula. For example, the function that assigns each real number x to 5 more than twice of x is expressed as
y = 2x + 5
So the function assigns 1 to 7 because
2(1)+5 = 7
Similarly
2(3)+5 = 11
2(6)+5 = 17
which says 3 and 6 are assigned to 11 and 17, respectively.
The letters such as x and y that appear in the definition of a function are called variables. The variable x is called the independent variable and the variable y is called the dependent variable. More often a more descriptive notation is used to show the dependency of the value of y on the value of x by writing
y(x) = 2x + 5
When using this notation, we usually use the letter f (or g, h, etc.) instead of y and write
f(x) = 2x + 5
With this notation we have a more descriptive way of expressing the above calculation
f(1) = 2(1)+5 = 7
f(3) = 2(3)+5 = 11
f(6) = 2(6)+5 = 17
If b = f(a), b is said to be the value of f at a. By evaluating the function f at a we mean finding f(a).
We may also write y = f(x) when we want to say, in general, that y is a function of x. In this case f(x) is understood to be an expression in x.
Remark: it is immaterial what variables are used for defining a function. That is, y = f(x) or u = f(v) or r = f(θ) can all be used to define or identify the same function f.
Cartesian and Polar Graphs of a Function
Just as a given point can be graphed in the Cartesian or polar coordinate systems, a given function f can be graphed using either of the coordinate systems because the graph of a function is the set of ordered pairs (a, b) where a and b are paired by the defining function f.
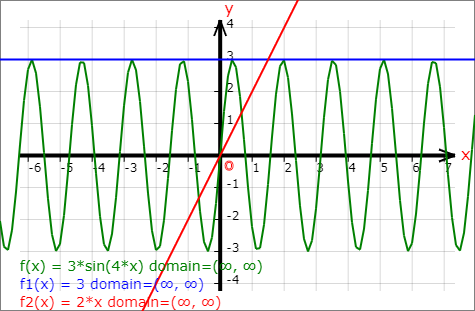
The graph of the function f in the Cartesian coordinate system (or the Cartesian graph of f) is the set of all points (x, y) where y = f(x), or equivalently, (x, f(x)) for x in the domain of f.
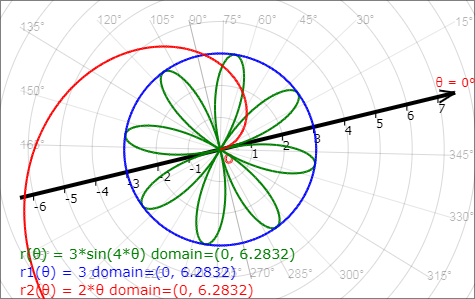
The graph of the function f in the polar coordinate system (or the polar graph of f) is the set of all points (r, θ) where r = f(θ)), or equivalently, (f(θ), θ) for θ in the domain of f.
When graphing a function in the Cartesian coordinate system, it is customary to use x and y and write y = f(x); and when graphing in the polar coordinate system, it is customary to use r and θ and write r = f(θ).
Remark: : It is customary to write the ordered pair (f(θ), θ) as (r(θ), θ) just as (x, f(x)) can be written as (x, y(x)).
The following figures created by the graphing calculator show the graphs of some functions drawn in the Cartesian and polar coordinate systems.
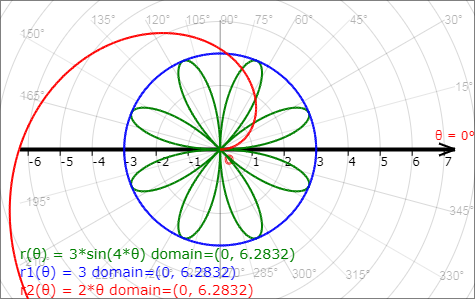
The graphs of the same functions as above drawn with axes rotated in each coordinate system.